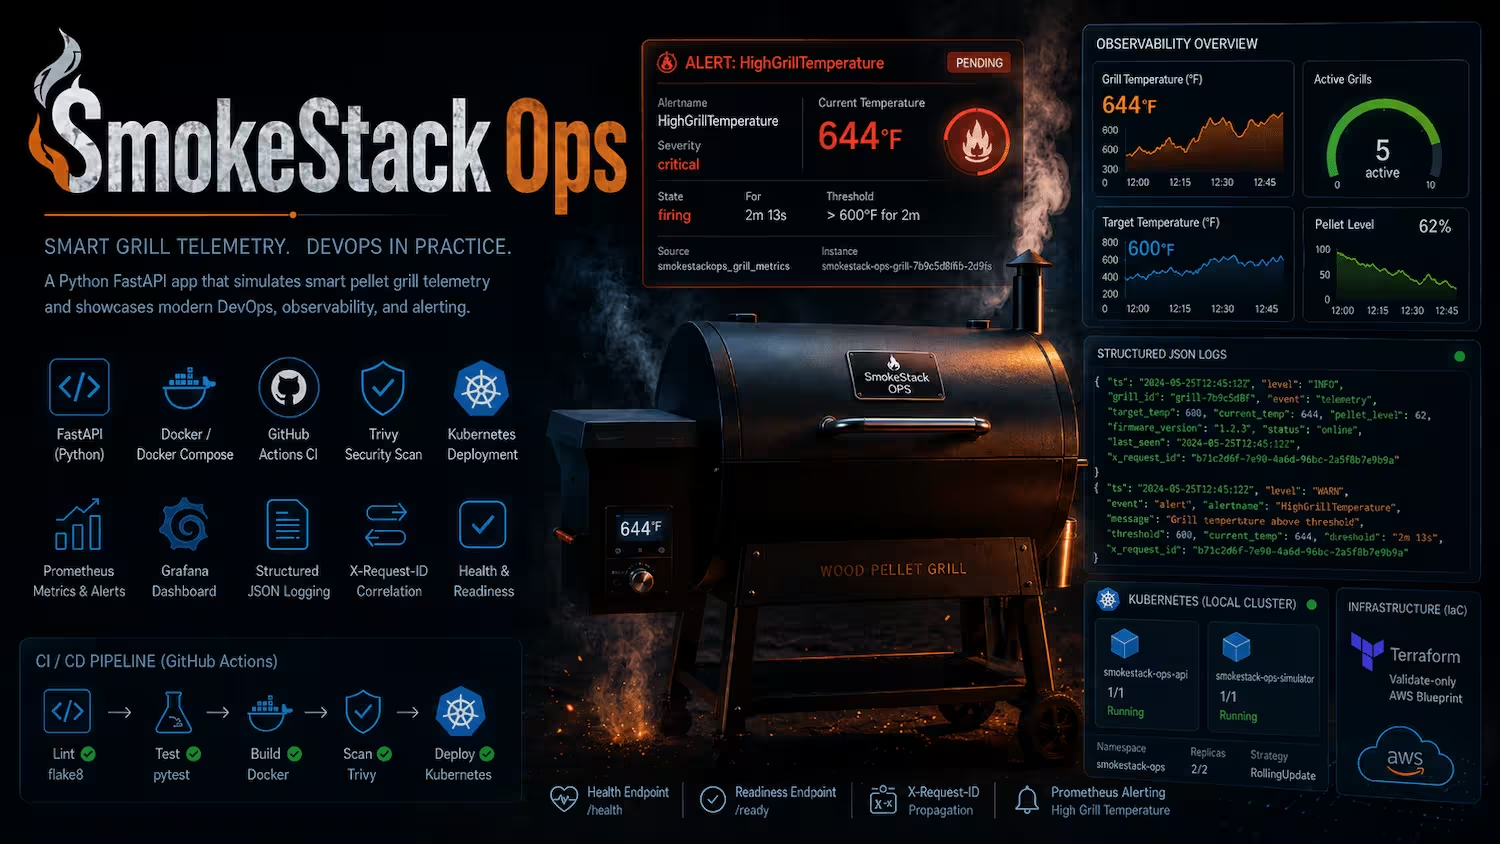
SmokeStack Ops started as a small DevOps portfolio project: a FastAPI service that simulates telemetry from
smart pellet grills. The application itself is intentionally simple, but the operating environment is where the
real learning happens.
The observability loop
I wanted the project to demonstrate more than "an app runs in Kubernetes." I wanted it to show a realistic
observability loop: expose application metrics, scrape every running API pod, visualize service behavior in
Grafana, trigger a real alert condition, and document how to investigate and resolve it.
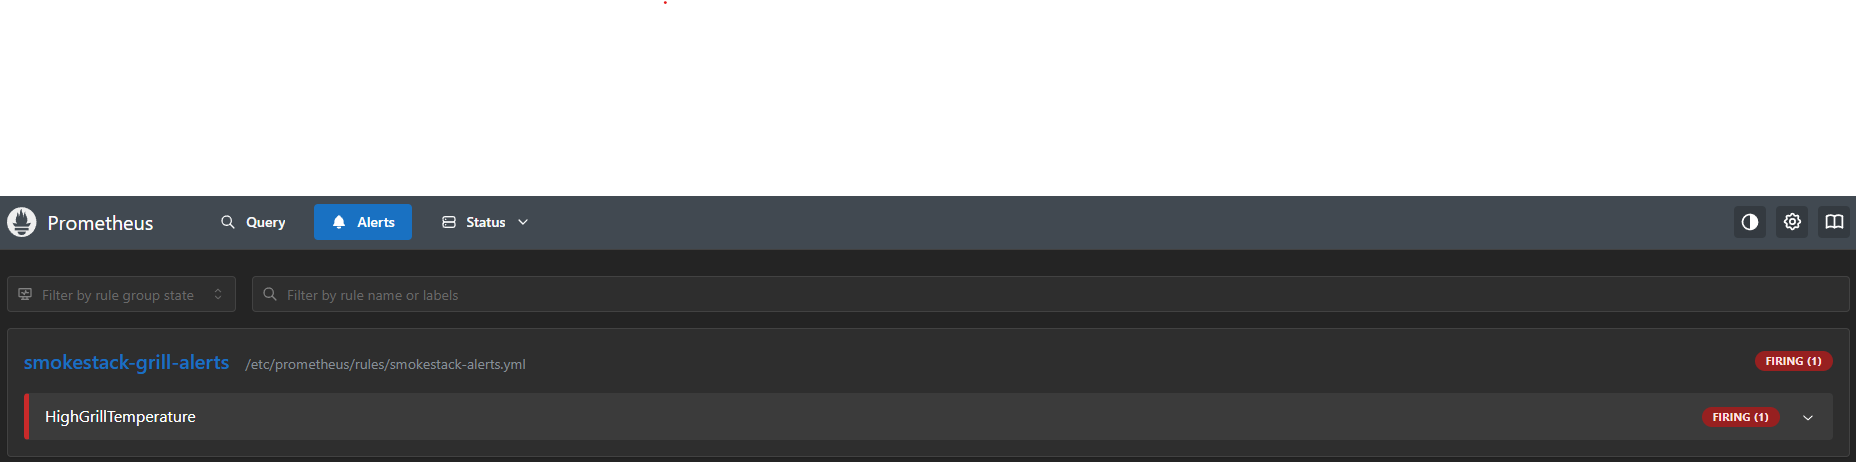
The final result is a local Kubernetes observability setup where a simulated grill temperature incident
appears in Prometheus, fires a HighGrillTemperature alert, shows up in Grafana, and then
resolves automatically after one minute.
The application
SmokeStack Ops is a Python FastAPI service with a few operational endpoints:
FastAPI endpoints
HTTP
GET  /health
GET  /ready
GET  /grills
POST /simulate/spike
GET  /metrics
The service exposes Prometheus-compatible metrics using prometheus_client:
Application metrics
Prometheus
smokestack_api_requests_total
smokestack_active_grills
smokestack_grill_temperature_fahrenheit
smokestack_pellet_level_percent
The most important metric for the incident workflow is
smokestack_grill_temperature_fahrenheit. Each grill reports a temperature by
grill_id, and normal simulated grill temperatures are randomized between 180F and
450F.
Simulating a real incident
To make alert testing repeatable, I added a dedicated incident grill named
grill-incident-demo.
Trigger the spike
PowerShell
Invoke-RestMethod -Method Post http://localhost:8000/simulate/spike
When that endpoint is called, the API sets the incident grill temperature to 625F. The
incident stays active for 60 seconds, then returns to a safe idle value of 225F.
Incident response
JSON
{
  "event": "temperature_spike",
  "grill_id": "grill-incident-demo",
  "current_temp": 625,
  "severity": "critical",
  "alert_threshold": 600,
  "duration_seconds": 60,
  "expires_at": 1783463655
}
I also added random scheduled demo incidents. During /metrics scrapes, each API pod can start a
one-minute incident every three to seven minutes. That gives the monitoring system something realistic to
catch even when I am not manually triggering the endpoint.
The first Prometheus problem
The original Prometheus configuration scraped the application through the normal Kubernetes Service:
Original target
Kubernetes DNS
smokestack-api-service.smokestack.svc.cluster.local:80
That worked while there was only one pod, but it was not good enough once the deployment had two replicas.
The incident metric is stored in the memory of the API pod that handled the request. If
/simulate/spike hits pod A, but Prometheus' next scrape through the load-balanced Service hits
pod B, Prometheus can miss the incident.
That is a subtle but important observability bug. The app had the metric, and Prometheus had a scrape
target, but the scrape topology was wrong for per-pod in-memory metrics.
Fixing Prometheus with per-pod scraping
I added a headless Kubernetes Service just for metrics:
Headless metrics Service
YAML
apiVersion: v1
kind: Service
metadata:
  name: smokestack-api-metrics
  namespace: smokestack
spec:
  clusterIP: None
  selector:
    app: smokestack-api
  ports:
    - name: metrics
      protocol: TCP
      port: 8000
      targetPort: 8000
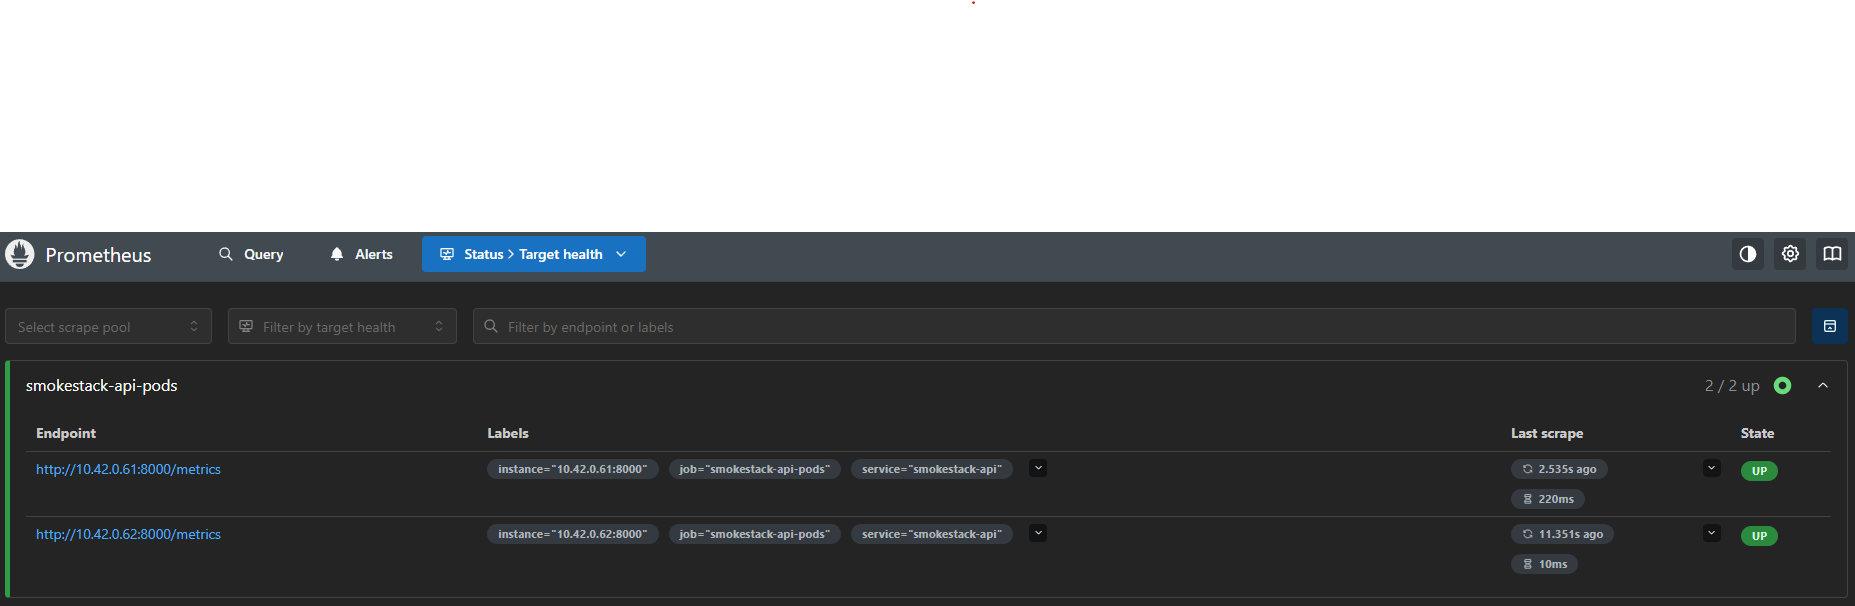
Because this Service is headless, DNS resolves to the individual API pod IPs instead of one load-balanced
virtual IP. Prometheus can then use DNS service discovery to scrape each pod directly.
Prometheus scrape config
YAML
scrape_configs:
  - job_name: "smokestack-api-pods"
    metrics_path: "/metrics"
    dns_sd_configs:
      - names:
          - "smokestack-api-metrics.smokestack.svc.cluster.local"
        type: A
        port: 8000
Now Prometheus sees each API pod as its own target.
The alert rule
The Prometheus alert rule is intentionally simple: if any grill reports a temperature above
600F for 30 seconds, fire a critical alert.
HighGrillTemperature
YAML
- alert: HighGrillTemperature
  expr: smokestack_grill_temperature_fahrenheit > 600
  for: 30s
  labels:
    severity: critical
    service: smokestack-api
    team: devops
  annotations:
    summary: "High grill temperature detected"
    description: "Grill {{ $labels.grill_id }} is reporting {{ $value }}F, which is above the 600F safety threshold."
    runbook_url: "docs/high-temperature-incident-runbook.md"
The manual incident lasts 60 seconds, and the alert requires the condition to hold for 30 seconds. That
gives Prometheus enough time to scrape and evaluate the spike before the metric resolves.
Useful Prometheus checks
PromQL
smokestack_grill_temperature_fahrenheit{grill_id="grill-incident-demo"}
ALERTS{alertname="HighGrillTemperature"}
Grafana got messy, then better
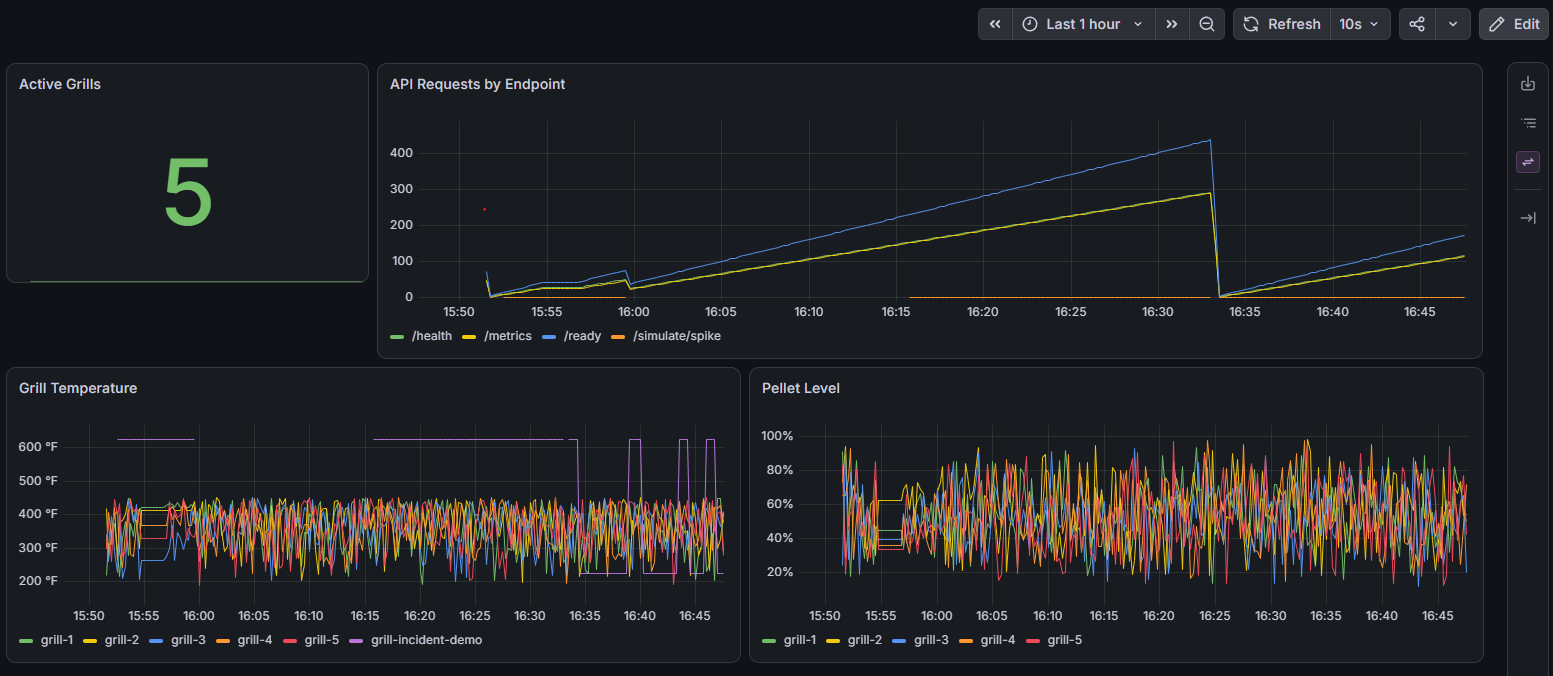
Once Prometheus started scraping each pod, Grafana initially looked messy. The dashboard was showing
duplicate series because each API pod exported the same logical grill IDs. For troubleshooting, raw per-pod
series are useful. For a dashboard, they are noisy.
I changed the Grafana queries to aggregate pod-level metrics into logical application-level views:
Dashboard queries
PromQL
max(smokestack_active_grills)
sum by (endpoint) (smokestack_api_requests_total)
max by (grill_id) (smokestack_grill_temperature_fahrenheit)
avg by (grill_id) (smokestack_pellet_level_percent)
The temperature panel uses max by (grill_id) so the incident stays visible even if only one API
pod reports 625F. That gave the dashboard the right balance: Prometheus still has pod-level
detail for investigation, while Grafana tells the application-level story clearly.
Runbooks matter
I also added a high-temperature incident runbook, and the alert links directly to it through
runbook_url. The runbook explains what condition triggered the alert, how to query the incident
metric, how to check Prometheus targets, how to inspect API pod logs, and what normal resolution looks like.
For this demo, resolution is expected after the 60-second incident window expires. Prometheus should then
scrape the safe 225F value and clear the alert.
What I learned
The most useful part of this project was not just adding Prometheus. It was finding the edge case where
"Prometheus is scraping the app" was technically true, but still not reliable enough.
The important lesson: if an application exposes pod-local metrics, Prometheus should scrape the pods, not
only a load-balanced Service.
The other lesson was about dashboards. Raw Prometheus series are great for investigation, but Grafana panels
often need aggregation so they tell the operational story clearly.
Final architecture
At the end of this iteration, SmokeStack Ops has:
- FastAPI application metrics
- Kubernetes deployment with two API replicas
- headless metrics Service for per-pod discovery
- Prometheus scrape config and alert rule
- Grafana dashboard with aggregated app-level panels
- one-minute manual and scheduled incident simulation
- operational runbooks for troubleshooting
This turned a simple portfolio API into a small but realistic incident monitoring workflow.
Back to blog